Balance of payments (BoP) statistics provide a comprehensive record of Tonga’s economic relationship with the rest of the world.
Tonga’s BoP statements record economic transactions between Tonga and the rest of the world (or in other words, transactions of residents of Tonga with non-residents). They show the value of goods, services, income, transfers and changes in Tonga’s claims on the liabilities with foreigners.
The Department provides fiscal and quarterly Balance of Payments statistical data.
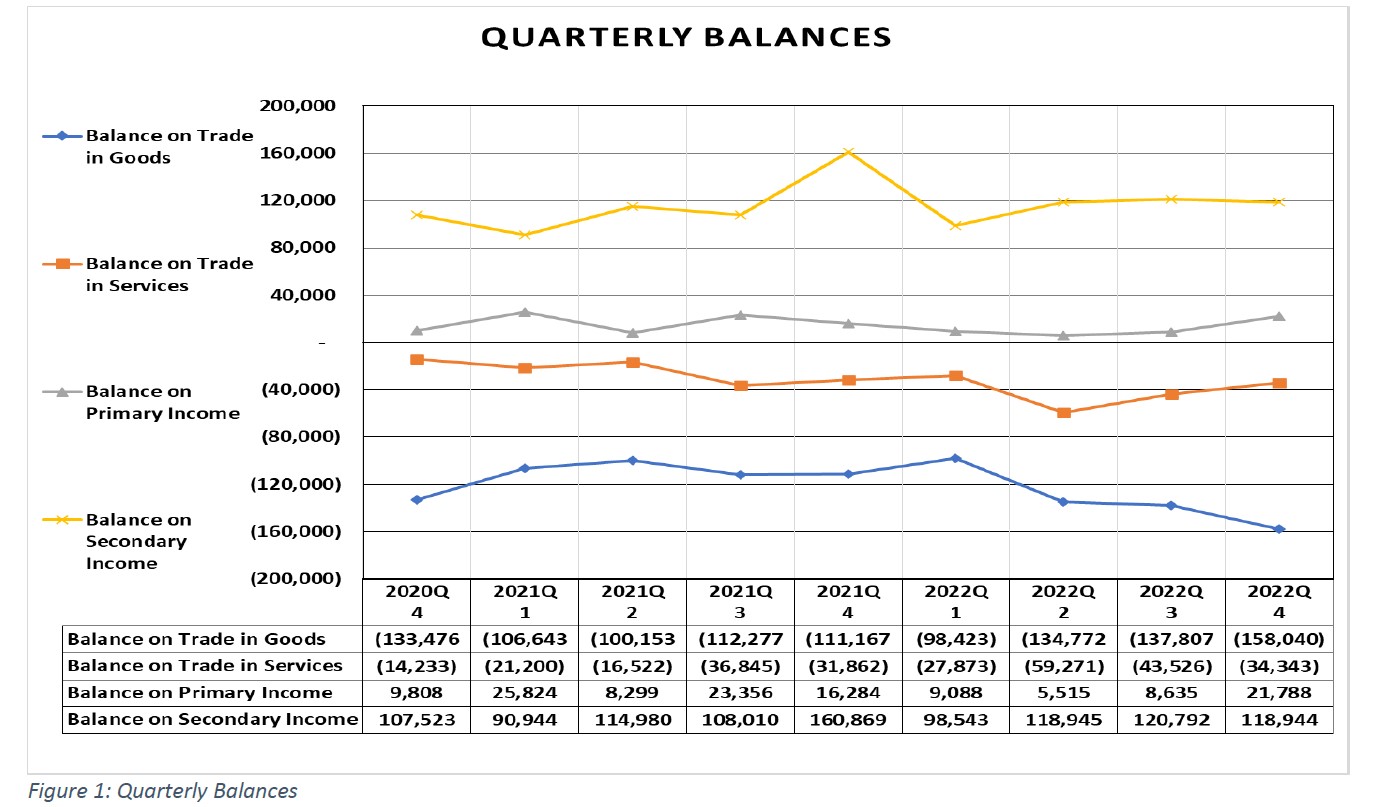
Balance on Goods and Services
December 2022 Quarter 192,383
Balance on Primary Income
December 2022 Quarter 21,788
Balance on Secondary Income
December 2022 Quarter 118,944
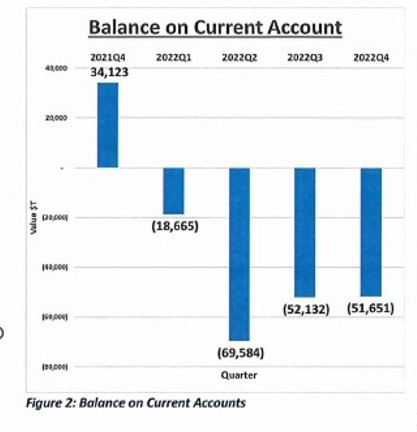
Balance on Current Account
December 2022 Quarter 51,651
Balance on Goods and Services + Balance on Primary Income + Balance on Secondary Income = Balance on Current Account
Latest BoP Quarter release
BOP_Quarter 4_2022
Latest BoP Annual release
2021-2022 Balance of Payments Annual Report
All BoP releases
| Title | Download |
|---|---|
| Balance of Payment Summary | Download |
Contact Person: Fatai Kaufusi